We’re excited to announce the launch of our brand new Reporting Dashboard for the Drag & Drop editor. Improve your content’s performance with easy access to the most important metrics.
Foleon makes it easy to produce interactive digital content, empowering brands across the world to push their sales and marketing collateral into a new era of design.
If you’ve worked with Foleon before, you’re probably very familiar with the content creation process. However, beyond simplifying the creation process, we also empower you to improve your content over time with page-by-page analytics.
An easier approach to analytics
To make analytics more accessible, usable, and powerful, we recently launched a brand new Reporting Dashboard. It gives you easy access to the most important metrics on your content’s performance. Analyze how your content is performing and collect learnings to make your next piece of content even better.
With our new Reporting Dashboard, you can bid farewell to endless sifting through Google Analytics data to find those few important metrics. Foleon has the native ability to:
- Easily analyze content performance.
Our dashboard has been designed to give you quick access to the most important metrics.
- Drill down into individual publications and pages.
Drill down into different publications and see the performance of individual pages.
- Convert metrics into actionable insights.
By only displaying the most relevant metrics and leaving out all the distraction, you’re better equipped to distill concrete to-dos.
Introducing the new Reporting Dashboard
The ability to see how your Foleon content performs has always been one of the most important drivers for success with our software. That's why we decided to build our very own Data Engine, designed specifically for the Drag & Drop editor.
Important note
Our Data Engine has been collecting performance metrics on your content since the 28th of September, 2018. If you have (re-)published a Drag & Drop publication since then, you’ll see stats in the Reporting Dashboard starting from the date when you (re-)published.
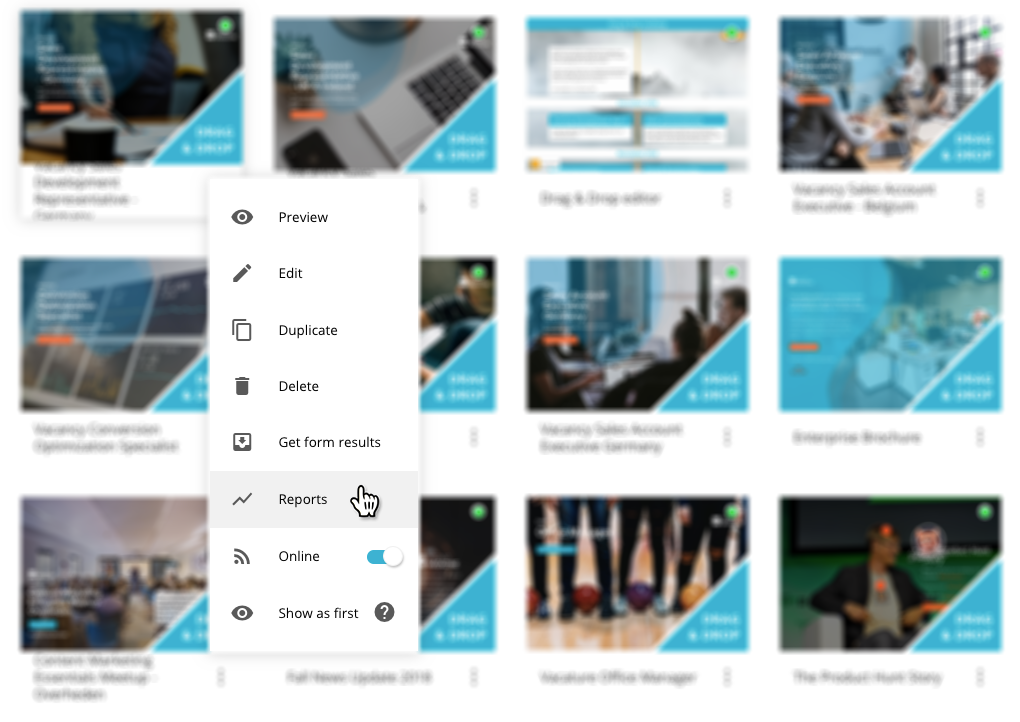
Available to all licenses, you can easily access the Reporting Dashboard by clicking on the 3 dots of any published Drag & Drop publication and selecting Reports.

What metrics are available to you?
We’ve dedicated a lot of time analyzing the performance of all kinds of content created with Foleon. Based on our experience and feedback from customers, we selected the most important metrics for assessing your content’s success — and improving its performance down the line.
Once in the new Reporting Dashboard, you’ll see how to switch to other (Drag & Drop) publications for analysis — as well as the date range — in the upper left and right-hand corner of your screen. Both can be adjusted with just a few clicks.
Below that are visualizations and charts for your metrics. If you’ve ever used Google Analytics, you’ll be very familiar with these.

On a publication level, you’ll see:
- Visitors – The number of individuals who viewed your publication.
- Sessions – The number of visitors who viewed your publication, a user can have multiple sessions.
- Pageviews – How many times pages in your publication were viewed overall.
- Pages/session – The average number of pages viewed per session.
- Average session duration - The average amount of time spent in your publication.
- Bounce rate – The percentage of visitors who only viewed a single page in your publication.
- A pie chart showing the percentage of new visitors vs. returning visitors.
- A pie chart showing the proportion of users that used desktop, tablet, and mobile devices.

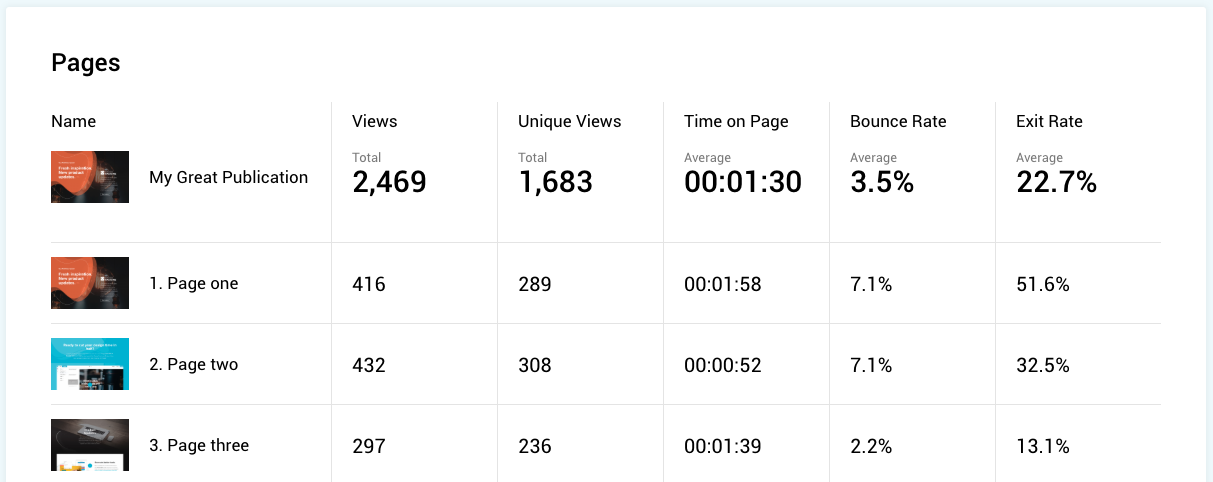
On a page level, you’ll see:
- Views – The number of times a page has been viewed.
- Unique views – The number of unique visitors that viewed a page; this doesn’t count multiple visits from the same visitor.
- Average time on page – The time visitors spent on a page.
- Bounce rate – The percentage of visitors who entered your publication on a page but left without viewing any other pages.
- Exit rate – The percentage of visitors who left your publication on a page.
See how we calculate the different metrics in our Help Center here.
Check out the reporting dashboard to see your data
Log in
Our plans for the future
These insights have helped our clients exponentially grow their lead volume, readership, and more. By far, they are the most relevant metrics for the success of your Foleon content. However, as we continue to grow as an organization, we will continue to add more in-depth and powerful analytics for you. Some of what you can look forward to includes:
- Click maps
- Heatmaps
- Scroll maps
- Conversion tracking through social shares and form submissions
- Overall performance scores for pages
- Performance comparisons among publications
- Reader funnels
- and more...
Conclusion
As you create content with Foleon, we want to ensure that is not just beautiful, but that it works for you. You should know exactly what the ROI of your content is and how to improve it. We are certain that our new Reporting Dashboard will make those goals more attainable than ever before.
If you have feedback or suggestions for the Reporting Dashboard, feel free to let us know via the feedback widget. Alternatively, you can also reach out to our awesome support team via support@foleon.com. We’re all ears!

.png)