Platform > Data & Intelligence
Finally know who's reading your content.
Foleon turns every paragraph into a measurable touchpoint. Track engagement, capture intent, and feed signals into the tools your revenue team already uses.


.svg)
.svg)
.svg)


Content Analytics
Know what's working. Make content that performs.


Revenue Intelligence
Know who's hot. Act before your competitors do.
Conversational assistant
Let your readers interrogate the content.
Long-form content is powerful — but not everyone wants to scroll through 30 pages to find the one number they need. Foleon's in-Doc conversational assistant lets readers ask questions, summarize sections, and surface specific information directly inside a published Foleon Doc.
For your audience, it's a faster way to get value from your content. For your team, it's a new layer of intent data. Every question a reader asks tells you what they care about — what they're evaluating, what they're comparing, and what they're trying to decide.
Your content doesn't just get read. It gets questioned.

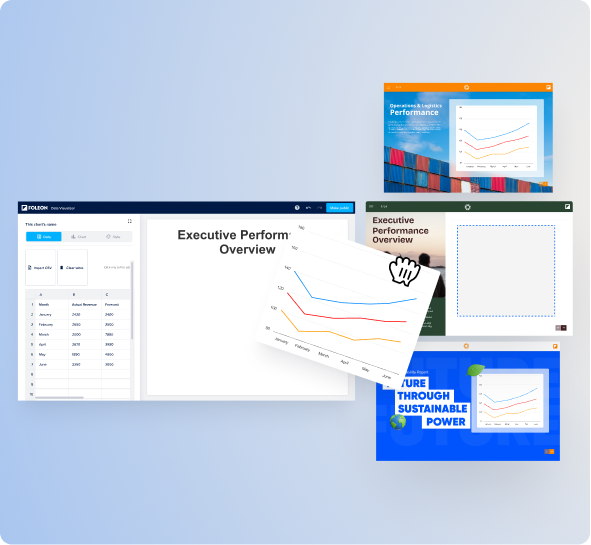
Foleon Data Visualizer
Build polished, on-brand charts directly inside your content workflow. Brand Kit styling is applied automatically, and charts are saved as reusable assets you can duplicate, update, and embed across any Foleon Doc.
Learn more
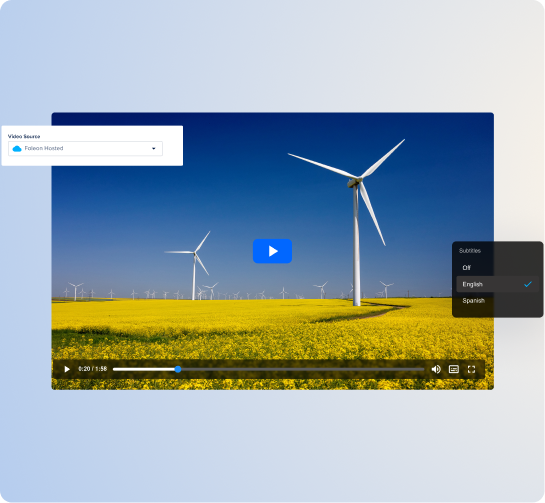
Foleon Video Hosting
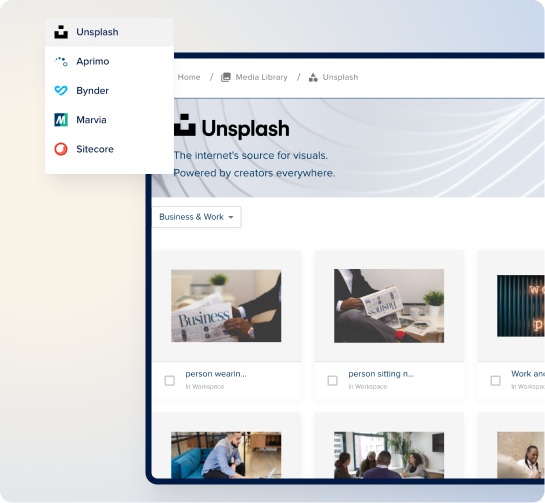
Stock and media libraries
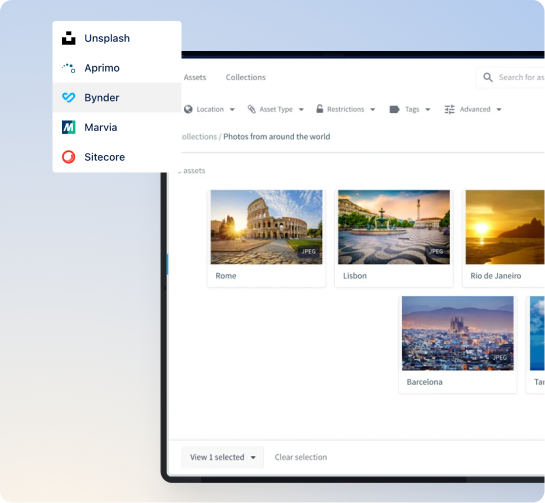
DAM connectors
Connect Bynder or Aprimo so teams always pull from approved, current asset versions — governed at the source.
And more
From form providers to social embeds to custom widgets, Foleon integrates with the tools that make your content richer. If it can be embedded, it can live in a Foleon Doc.
Foleon Data Visualizer
Build polished, on-brand charts directly inside your content workflow. Brand Kit styling is applied automatically, and charts are saved as reusable assets you can duplicate, update, and embed across any Foleon Doc.
Learn more
Foleon Video Hosting
Stock and media libraries
DAM connectors
Connect Bynder or Aprimo so teams always pull from approved, current asset versions — governed at the source.
And more
From form providers to social embeds to custom widgets, Foleon integrates with the tools that make your content richer. If it can be embedded, it can live in a Foleon Doc.