In our previous post about business statistics, we discussed the basics of Google Analytics. If you missed that post, or if you need to brush up on your Google Analytics knowledge, check it out before reading this one.
In this post, we’ll go a bit deeper into methods for measuring the effectiveness of your sales and marketing collateral. We’ll dig into using segments to look at behavioral differences among visitor groups, as well as tracking exit rates and events for detailed insights into your content assets’ performance.
Learning effective analysis is part of any successful content marketing strategy.
Google Analytics segments: Recognizing and learning from visitor groups
The default data presented by Google Analytics gives you a general idea of your visitors’ activities. But how interesting is it to only know that your average visit duration is four minutes and ten seconds? The real value is in predicting who will spend longer on a piece of content or complete a goal based on the details of their visit.
You can obtain these metrics by using segments to isolate groups of visitors and compare them to one another. By creating multiple segments, you’ll find differences in behavior and interests among various sub-groups.
One thing worth noting is that in order to get valuable information from your segments, it’s vital to set clear goals for your publications! Learn how you can define a super clear goal with even more concrete objectives.
What are segments?
Segments are groups of visitors, subsets of your traffic. They let you do things like measure whether visitors coming from an email view more pages or visit your publication for longer periods of time than those coming from a link on Facebook. Segments also enable you to distinguish between mobile, tablet, and desktop visitors to your marketing materials and analyze their behavior. Do smartphone users read as much of your magazine as those using larger devices? Heck, you can compare almost anything.

By creating a segment for each Foleon publication, you can also compare their relative success. This enables you to optimize your collateral and improve over time.
Default segments and custom segments
Google Analytics lets you choose from a number of default segments such as All visits, New visitors, and Returning visitors. In addition to these segments, you can create custom segments based on demographics, device and OS, behavior, date of first session, or traffic sources.
Creating segments for each content asset with Foleon
Did you list all your collateral under a single UA code in Analytics? If so, all your visitor data will be amalgamated, and you will soon be unable to see the forest for the trees! A better practice is creating a segment for each publication so that you can analyze each one separately.
There are multiple ways to create your segments. We recommend creating them based on their URLs or their page titles. The latter is the simplest method.
Before creating a segment, you’ll need to understand how page titles are structured. Every page title of your publication looks like this:
Page title - Publication title
As an example, we’ll create a segment for our Drag & Drop Launch magazine. The title of the publication is “Drag & Drop”. The page title of the first page is “Introduction”. Therefore the full page title is:
Introduction - Drag & Drop
So, let’s put the publication title into the segment builder and see what happens.
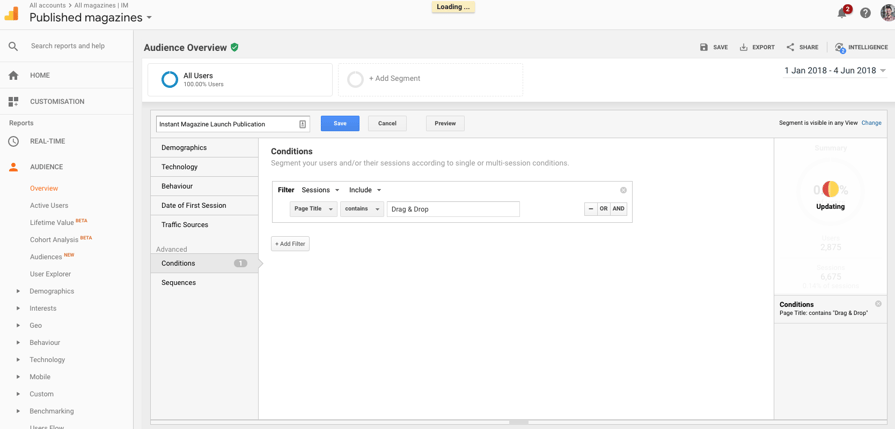
- On the Reporting page, click the Add segment > New segment button and then click on Conditions under Advanced.

- Set the filter to Page title (or ‘page’ for URL filter), select contains, and then enter the publication title. In our case, this would be ‘Drag & Drop’.
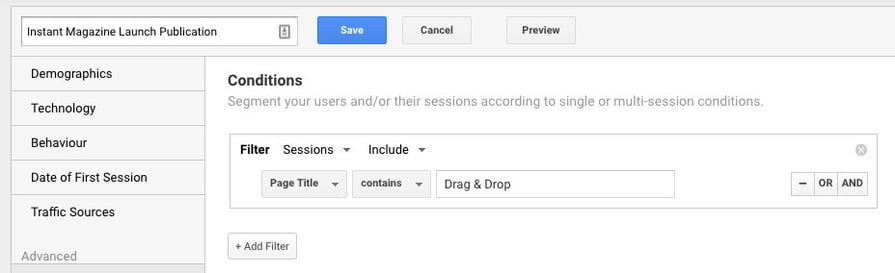
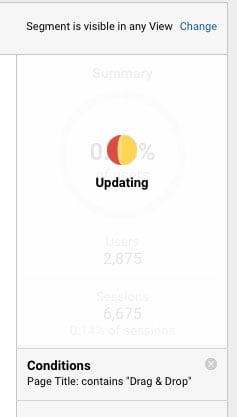
- You will see that Google Analytics provides you with options once you start typing.
- Don’t forget to name your segment so you can easily find it again.
And you’re done.
You can create a segment for all of your publications. This is especially relevant for content such as magazines, which have multiple editions. For example, two subsequent monthly editions might have Page title contains Magazine October and Page title contains Magazine November.
This enables you to easily compare the statistics of your various editions!
Important metrics for measuring your content’s success
Creating segments means you will generate lots of visitor data. But which metrics are the most important? Our blog about the basics of Google Analytics looks at traffic sources, main content, mobile, visit duration, visit depth, and conversions. You can take this one step further by analyzing exit rates and bounce rates.
Exit rate: where do visitors click away?
The exit rate is the percentage of visitors who leave on a specific page after having first visited multiple pages. This is different than the bounce rate, which measures the percentage of visitors viewing only one page and then leaving.
By monitoring the exit rate, you’ll see how well the various pages of your publication perform. You can view the exit rate in Analytics at: Behaviour > Site Content > Exit Pages > Secondary dimension: Page title.

For example, if you create digital magazines and have a fixed issue rhythm, you can use the exit rate to look for trends among a number of different publications. Logically, the exit rate should be higher on the last page, but you might discover that readers tend to click away from specific regular features or columns.
A high exit rate on one page may mean your readers do not find the content on that page to be interesting or relevant enough. But note: the context is also important. If one of your pages refers to an offer or to your website’s contact page, then a high exit rate will be desirable!
Bounce rate: This is not the page you’re looking for
The bounce rate, as mentioned above, differs from the exit rate. You can use the bounce rate to determine the effectiveness of your cover or other pages where users land.
Context is an important factor as well here. You’ll always have bouncers. You have some users who just want to take a quick look, users who accidentally clicked on the link, some who are not interested in seeing the next page, and some who found what they were looking for on the page in question.
Get further insights with Google Analytics events
Events measure different actions carried out by a visitor: for example, how often a magazine is shared, how many times a video is viewed, or how often an overlay is opened.
You’ll find events in Analytics at Behaviour > Events > Overview.
An event consists of three dimensions:
- Event category
- Event action
- Event label
An example of a category is videos, the action may be playing, and the label indicates the event’s context (e.g. which video is played, the URL of an outbound click, or which hotspot is opened).
If you added a UA code to your Foleon publication, then we automatically measure all sorts of additional events, providing you with even more data. We keep everything convenient, requiring no action on your part!
We measure and record the following events:
Next steps: custom dashboards and custom reports
In this blog post, we’ve looked at how to get more out of Google Analytics by creating custom segments for insight into visitor groups and comparing your publications, as well as analyzing the exit rate and events metrics.
If you’re wondering how to keep these insights organized, we’ve got one final tip for you: Create custom dashboards (via Dashboards > New Dashboard).
You may already be using the default ‘My dashboard’ view, but you can create additional dashboards and customize them to your heart’s content. There are twelve widgets available, providing you with all sorts of dimensions and metrics.
Why not try a dashboard with statistics about your visitors or real time data. These will give you tons of relevant metrics